We examined MLS data for 12,711 home sales in St. Louis County, MO, from June 2023 to June 2024.
We examined the top 30 municipalities by number of sales, including unincorporated St. Louis County.
Here’s what we found in the St. Louis housing market:
- Condos are spending less time on the market than houses
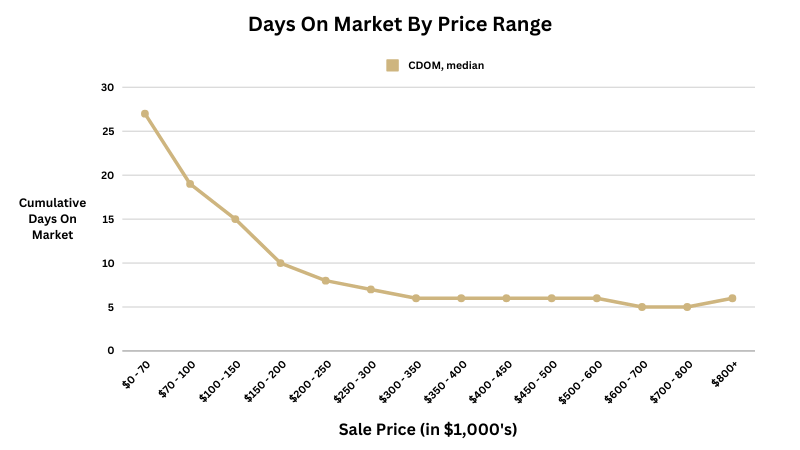
- Lower-priced homes take longer to sell
- High median prices in Mid and West County
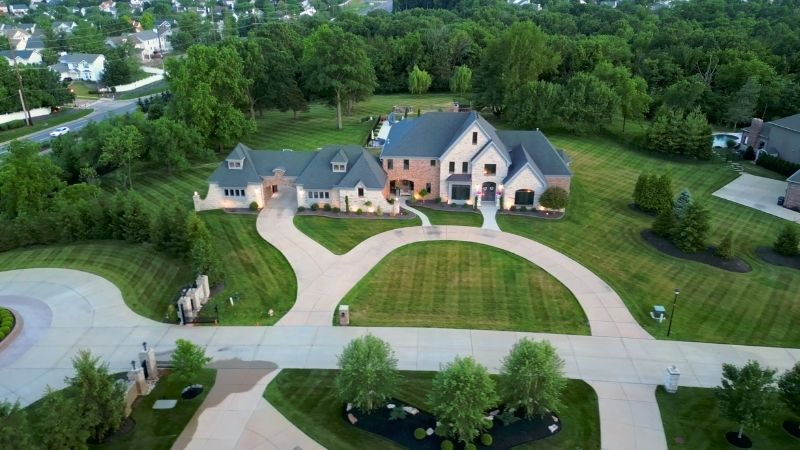
- Luxury home statistics (sales above $800,000)
How Fast Are Homes Selling in St. Louis County?
Condos and villas sell the quickest, with a median cumulative time-on-market of 7 days.
Single-family homes sold a bit slower, with a median of 10 days.
| Property Types | CDOM, Median | Closed Sales |
|---|---|---|
| Residential | 10 | 11,094 |
| Condo/Villa | 7 | 1,617 |
When Do the Most Home Sales Happen?
Over the last 12 months, August 2023 had the most sales, followed by May 2024.
- August 2023: 1,440 sales
- May 2024: 1,273 sales
- July 2023: 1,267 sales
- September 2023: 1,215 sales
- October 2023: 1,174 sales
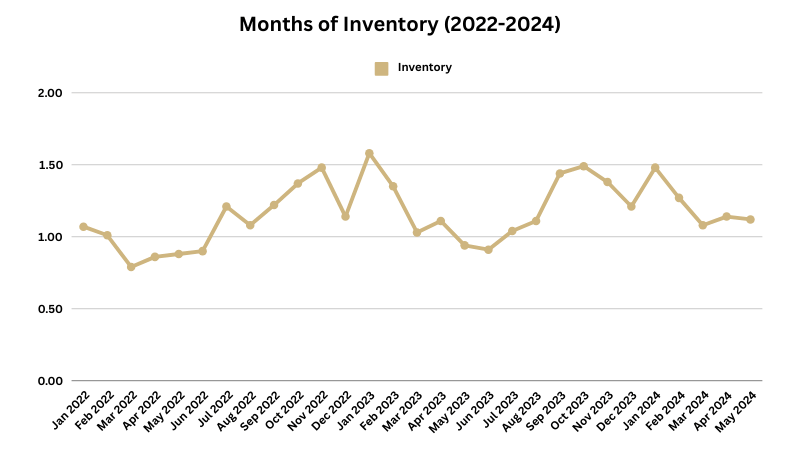
So far in 2024, market inventory has been hovering between 1 and 1.5 months.

Lower-Priced Homes Take Longer to Sell
Homes in St. Louis County priced at $70,000 or below took the longest to sell, with a Cumulative Days On Market (CDOM) of 27 days.
Here are the ranges with the highest median days on the market:
- $0 – $70,000: 27 days
- $70,001 – $100,000: 19 days
- $100,001 – $150,000: 15 days
- $150,001 – $200,000: 10 days
- $200,001 – $250,000: 8 days

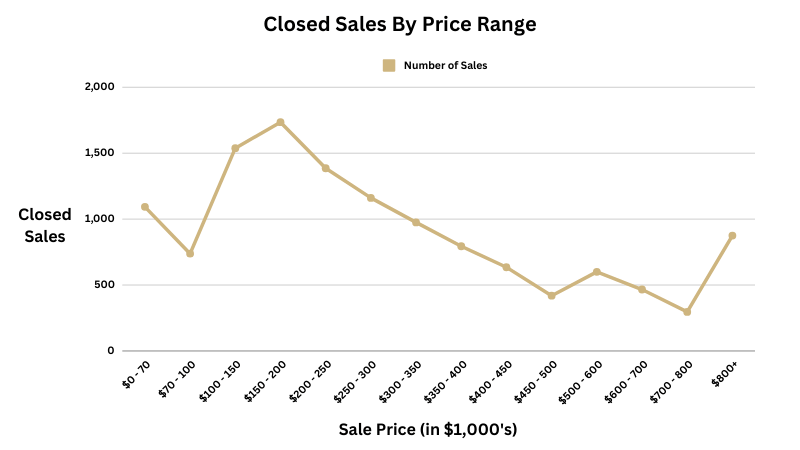
More homes sold between $150,000 and $200,000 compared to any other price range.

Unincorporated St. Louis County Wins By Volume
Unincorporated areas had the highest number of sales with 3,747 homes sold, significantly higher than any other municipality. Unincorporated STL County is the catch-all if a home is not located within a municipality.
High Median Sale Prices
Ladue had the highest median sale price at $1,100,000. It is consistently one of the most expensive areas in St. Louis County.
Highest median price ranked by municipalities with more than 90 closings (single-family, villa, condo):
- Ladue: $1,100,000
- Town and Country: $1,044,500
- Clayton: $685,000
- Des Peres: $681,250
- Wildwood: $5500,000
| Ranking | Municipality | Median Sale Price | Median CDOM |
|---|---|---|---|
| 1 | Ladue | $1,100,000 | 6 |
| 2 | Town and Country | $1,044,500 | 8 |
| 3 | Clayton | $685,000 | 15 |
| 4 | Des Peres | $681,250 | 5 |
| 5 | Wildwood | $550,000 | 6 |
| 6 | Chesterfield | $517,200 | 5 |
| 7 | Creve Coeur | $458,500 | 9 |
| 8 | Eureka | $400,000 | 13 |
| 9 | Webster Groves | $392,000 | 5 |
| 10 | Ellisville | $381,500 | 5 |
High Sale-to-List Price Ratios
Webster Groves had the highest median sale-price-to-list-price ratio at 102.40%, which is great for sellers.
Here are the top municipalities by sale-to-list ratio:
- Webster Groves: 102.40%
- Des Peres: 101.70%
- (tie) Ballwin & Crestwood: 101.50%
- Maryland Heights: 101.40%
- Manchester: 101.10%
Of the 30 municipalities we examined, 17 had a median sale-to-list price ratio of 100%, and 9 had a median above 100%.
Here are the 4 areas with the lowest list-to-sale ratio:
- Jennings: 96.30%
- Berkeley: 98.10%
- Bellefontaine Neighbors: 98.30%
- Clayton: 99.50%
Affordable But Slow Markets
Jennings, MO had the lowest median sale price at $55,350, making it one of the most affordable areas in the county by sale price.
Jennings had the highest median time-on-market of 37 days. Ferguson had the second longest time-on-market of 28 days. These areas are seeing the slowest turnover when new homes are listed.
| Municipality | Median CDOM | Median Sale Price |
|---|---|---|
| Jennings | 37 | $55,350 |
| Ferguson | 28 | $101,000 |
| Dellwood | 27 | $99,000 |
| Bellefontaine Neighbors | 26 | $90,500 |
| Berkeley | 20 | $89,000 |
| Hazelwood | 16 | $160,000 |
| Clayton | 15 | $685,000 |
| Florissant | 15 | $158,000 |
| Eureka | 13 | $400,000 |
| University City | 11 | $310,500 |
Luxury Home Statistics
We examined 850 sales over $800,000, which includes smaller municipalities that had too few sales to list above.

Where Luxury Homes Sell the Fastest
Chesterfield, Clarkson Valley, and Glendale had the shortest time on the market of 4 days.
Olivette had the longest, 34 days, followed by Huntleigh with 23 days.
The hottest market for luxury sales was Sunset Hills, with a median sale-to-list price ratio of 111.10% based on 11 closings over $800,000.
Westwood had the lowest ratio of 91.90%.
Here’s the data for home sales above $800,000:
| Municipality | CDOM, Median | Closings | Sale-to-List Ratio, Median |
|---|---|---|---|
| Chesterfield | 4 | 45 | 100.90% |
| Glendale | 4 | 10 | 100.30% |
| Clarkson Valley | 4 | 11 | 100.00% |
| Unincorporated | 4 | 8 | 100.00% |
| Sunset Hills | 5 | 11 | 111.10% |
| Webster Groves | 5 | 14 | 105.40% |
| Brentwood | 5 | 5 | 103.20% |
| Kirkwood | 5 | 23 | 102.00% |
| Ladue | 5 | 77 | 100.00% |
| Creve Coeur | 5 | 34 | 100.00% |
| Des Peres | 6 | 23 | 100.00% |
| Richmond Heights | 6 | 6 | 98.20% |
| Clayton | 7 | 73 | 100.00% |
| University City | 7 | 9 | 100.00% |
| Town and Country | 8 | 51 | 98.40% |
| Wildwood | 9 | 34 | 100.00% |
| Frontenac | 16 | 31 | 99.90% |
| Westwood | 17 | 6 | 91.90% |
| Huntleigh | 23 | 5 | 96.70% |
| Olivette | 34 | 14 | 100.00% |
Please note: This data does not include off-market sales that happened privately and were entered into the MLS retroactively.
Fair Use Policy
Feel free to use this data with proper attribution by linking to this study. We kindly ask that credit be given with a link to https://thestlrealtors.com


